FTIR analysis detect and quantify hazardous amounts of silica in coal mine dust. With this method, the dust can be analyzed quickly and thus improve the working environment for coal miners in the long term.
Coal mine dust – potential health risk
In light of the energy crisis caused by the war in Ukraine, a reestablishment of coal-fired power can be expected. This not only poses a problem in terms of climate change but might add to health issues of coal miners.
Miners are exposed to a variety of respiratory hazards in their work. The main problem is exposure to silica dust. The dust contains respirable crystalline silica, leading to cancer or lung diseases such as silicosis.
Silicosis led to such severe shortness of breath that in the final stages of their illness, many miners sat by the window to get at least some fresh air in the lungs. Actually, this was so common, that it even found its way into the German language as a proverb.
If someone was „Weg vom Fenster“ (Gone from the window) you would know that the silicosis found its gruesome end. To this day, „Weg vom Fenster“ is synonymous with death, or less morbid, if something is gone or no longer relevant.
FTIR analysis of coal dust
Even today, hundreds of miners in the U.S. still die each year from silicosis. Over 1 million workers in the U.S. continue to be exposed to silica dust daily.
For this reason, the U.S. Mine Safety and Health Administration (MSHA) mandates monitoring and quantification of occupational exposure to silica in air in U.S. mines [1-2].
However, current sampling and sample preparation is lengthy and cumbersome, preventing rapid response to overexposure.
Therefore, a faster and simpler method is now to be developed. This should make it possible to measure samples directly from a filter substrate using IR spectroscopy. The critical value for silicon dioxide is 100 micrograms per cubic meter of inhaled air.
Because of this, the instrument must be able to quantify small amounts. Additionally, the method must be able to differentiate between sample and the PVC filter that holds the sample.
Work safety demands analytical excellence
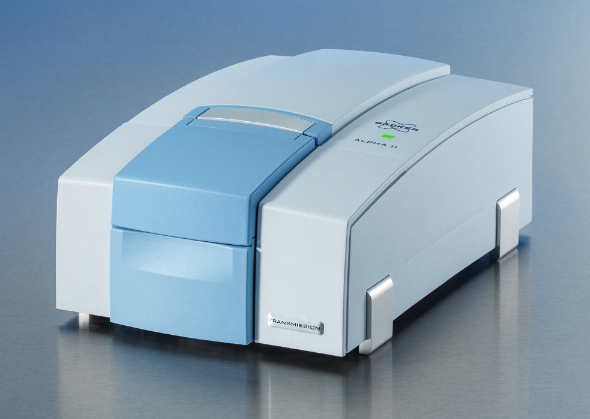
Our Bruker ALPHA II Spectrometer is excellently suited for this purpose. In a study with the ALPHA II, 15 samples were analyzed on PVC filters. The amount of silica ranged between 3-231 µg, that of carbon dust between 0.1 to 0.4 mg. Spectra of the carbon dust samples were recorded with a spectral resolution of 4 cm-1.
The figure shows spectra of PVC filters loaded with silica and carbon dust. Bands in the spectral range 830-760 cm-1 are assigned to the silicon dioxide and the carbon dust. They do not overlap with the bands of the PVC filter. However, the carbon and silica bands at 1036, 543, and 473 cm-1 overlap with the PVC bands.
For this reason, the initial calibration for silica and charcoal quantities was made using the partial least squares (PLS) model. The PLS analysis was performed using the Bruker OPUS Quant 2 package. The package allows the models to be automatically optimized. It was determined that the first derivative plus vector normalization within the spectral range 1485-405 cm-1 was optimal for processing the specific data set.
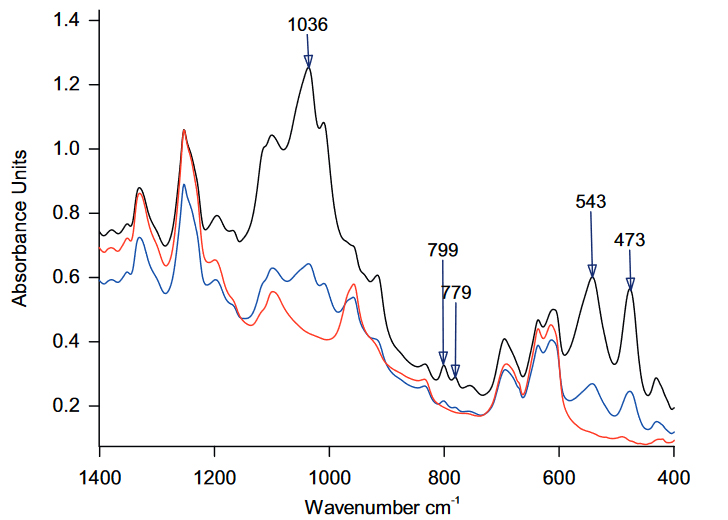
1.299 mg coal /70 mg silica (blue), and 3.982 mg coal/230 mg silica
(black).
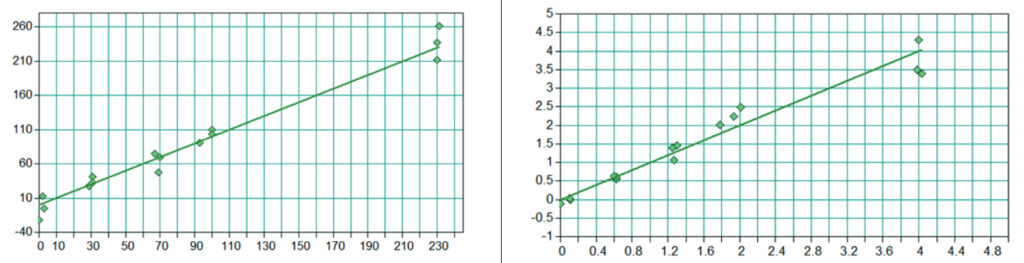
The figure below shows the cross-validation results for coal and silica. Even such a small sample set gives an accurate calibration with a coefficient of determination (R2) of 95.61 for coal and 97.13 for silica. This limited sample data set demonstrates that Bruker ALPHA II-T instruments can perform transmission spectral analysis of coal dust samples. A detailed analysis with a larger data set is described in [3,4].
FTIR analysis in China
China is a global player in coal mining as well. Therefore it is also using FT-IR spectroscopy to determine the content of respirable silica dust in its mines. You can watch this interesting video about silica analysis on our YouTube Chanel for more information.
Conclusion
The Bruker ALPHA II-T FTIR spectrometer can be used for the quantitative analysis of carbon and silica in the coal dust that is on the PVC filter. The high sensitivity of this method allows rapid quantification of silica below the regulated respirable limit.
References
[1] E. Cauda, A. Miller, P. Drake Journal of Occupational andEnvironmental Hygiene, 16 ( 2016) D39-D45
[2] A. Miller, P. Drake, N Murphy, J. Noll, J. Volkwein, J. Environ.
Monit., 14 (2012), 48-55
[3] A. Weakley, A. Miller, P.R. Griffiths, S.J. Bayman. Anal.
Bioanal. Chem. (2014) 406, 4715-4724
[4] A.L. Miller, A.T. Weakley, P.R. Griffiths, E.G. Cauda, S. Bayman, Applied Spectroscopy (2016)