In this blog entry we want to explain the differences between mapping and imaging in FTIR microscopy. Here we compare the N2 cooled Mercury cadmium telluride (LN2-MCT) detector with a Focal-Plane Array (FPA) detector. The LN2-MCT detector is the most sensitive single-element detector. The FPA is a true imaging detector.
Before we go into detail, let’s explain the fundamental differences in both approaches first.
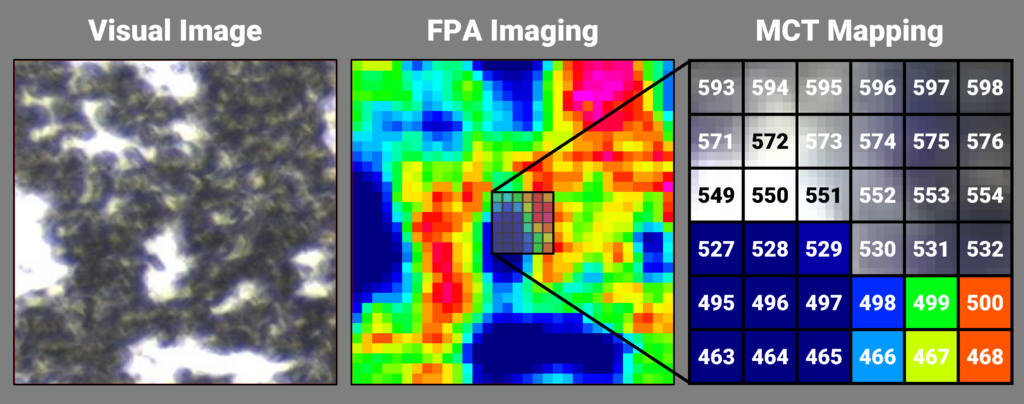
In FT-IR mapping, the use of a single-element detector, an aperture, and a high-precision stage allows spatial resolutions down to 5 μm. A grid of several measurement points with defined distance and a fitting aperture is chosen. Then the microscope scans the sample from spot to spot. This process is slow and can take hours or even days to complete depending on the sample and ROI.
In FT-IR imaging, a FPA detector is used were 32×32, 64×64 or more individual detectors are arranged in a rectangle. This works just like pixels in a digital camera. With this, the detector area of the individual elements replace the physical aperture.
With this more IR radiation can reach the detector. This results in a much better S/N ratio. Instead of needing 32×32 (1024) individual measurement points with a 5 μm aperture, the FPA can acquire the same information in a single, 2 second scan. Thus, maximum spatial resolution at minimum measurement times is feasible.
FTIR chemical imaging performance
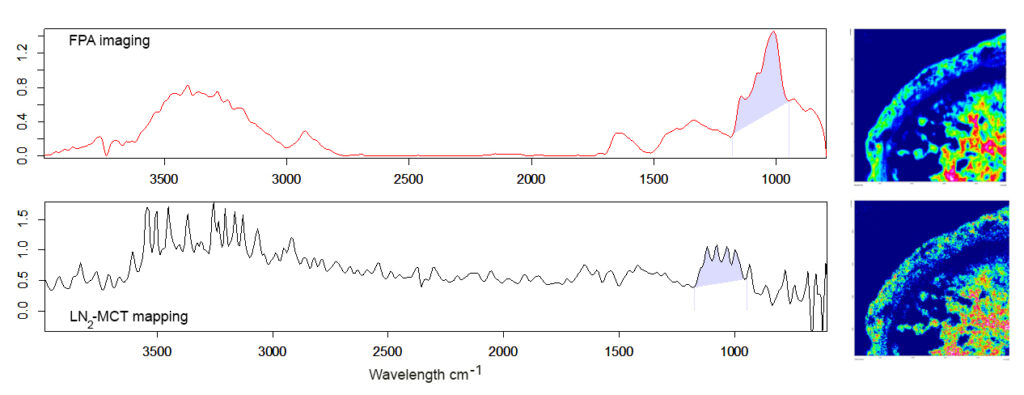
As a test sample a barley grain microtome cut was analyzed using most sensitive single-element detector (LN2-MCT) and a 32×32 FPA detector. Our LUMOS II FTIR microscope was used to measure the sample. For the FT-IR mapping, the aperture on the single-element detector was set to the FPA pixel size (5 μm) to obtain a comparable result.
A sample area of about 1 mm² was chosen. All other measurement parameters, like scan time, were set identically for both measurements. A total of 36.864 FT-IR spectra was collected. While the FPA finished the measurement in ~1 minute, the LN2-MCT detector needed 2 hours. More importantly, that tremendous speed increase has no negative effect on the spectral data quality. On the contrary, the image below clearly shows that the FTIR spectra obtained with the FPA are far superior to those from the LN2-MCT. They are ideal for identification by reference library search and the resulting chemical image is significantly richer in contrast.
LUMOS II – All-in-one FTIR device
If you are interested in FPA imaging, we can highly recommend our LUMOS II. It is a stand-alone FTIR microscope that excels in failure analysis, material research and particle analysis. The LUMOS II is compact, precise and features ultrafast chemical imaging by FPA technology. The microscope can be equipped with up to three detector positions: 2x single-element detector (e.g. TE-MCT + LN2-MCT) and 1x FPA detector.
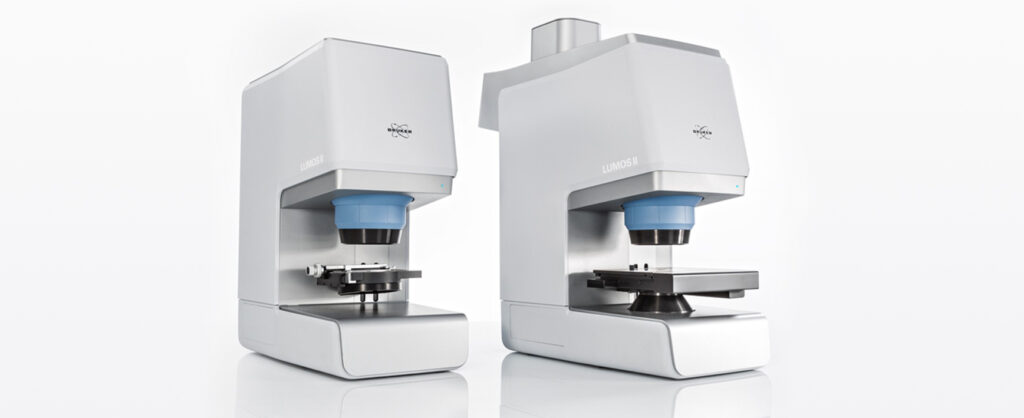
Whether you choose FPA imaging or single element mapping. The LUMOS II is always an excellent choice.