When it comes to choosing experiment settings, e.g. spectral resolution, many FT-IR beginners are insecure what the selected parameters mean and how they influence the experiment. In this article we want to shed some light on spectral resolution and give you a set of rules that will help you decide for the optimal settings.
We also want to clarify a misconception
It is generally assumed that the „better“ the spectral resolution, the better the performance of the spectrometer. However, as soon as you start to investigate the subject thoroughly, it quickly becomes clear that this does not correspond to reality. But lets start at the beginning.
What is spectral resolution?
The resolution of a spectrometer can be considered as the ability to separate two spectral lines that are very close in wavelength or frequency. This means that the more similar two IR bands are, the better the resolving power must be to separate them. Spectral resolution is given in wavenumbers (cm-1), corresponding to the x-axis in infrared spectra.
What are the optimal spectral resolution settings?
Naturally, the optimal settings depend on the application and sample at hand, but as rule of thumb you should go for:
- 4 cm-1 for standard solid and liquid samples in QA / QC
- 2 cm-1 to resolve all vibrational bands of a solid or liquid sample.
This will increase measurement time if you desire the same S/N ratio. - ≤ 1 cm-1 for most standard gas applications. Higher spectral resolutions may be required to fully characterize gas mixtures.
Important note: Resolutions < 2 cm-1 make no sense when analyzing liquids and solids! If you want to know how these values come about, you should read on.
Let’s take a look at an example:
Usually, you don’t need a very high spectral resolution to analyze solids and liquids for their identity and purity. 4 cm-1 is more than enough to safely identify a standard polymers such as polyethylene (PE). In the figure below you can see five spectra of polyethylene recorded at 8, 4, 2, 1 and 0.5 cm-1 resolution, respectively.
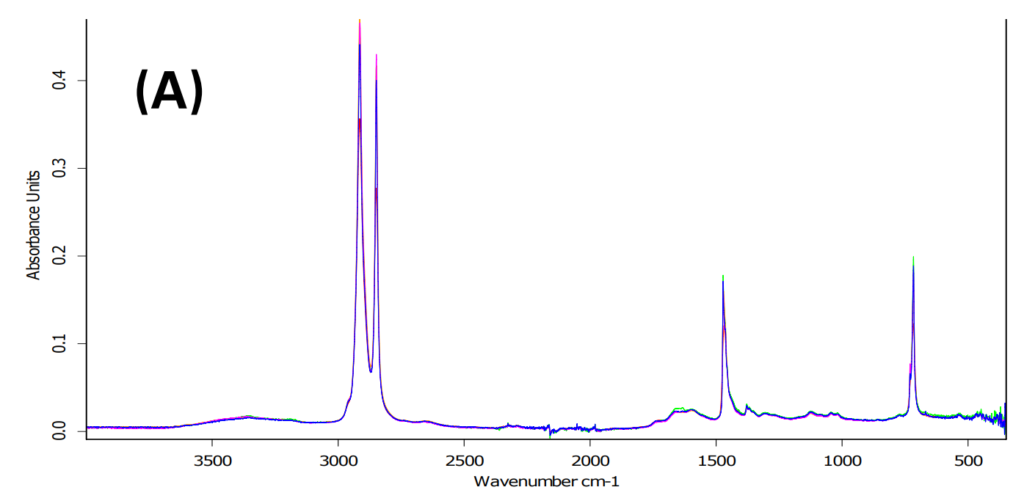
The five spectra appear as a single line and you can hardly spot any differences. However, there actually is a specific use case where the analysis of PE can profit from a resolution of better than 4 cm-1.
Polyethylene shows a certain band at 731 cm-1 which is indicative of its crystallinity. This band however is only resolved at 2 cm-1 resolution.
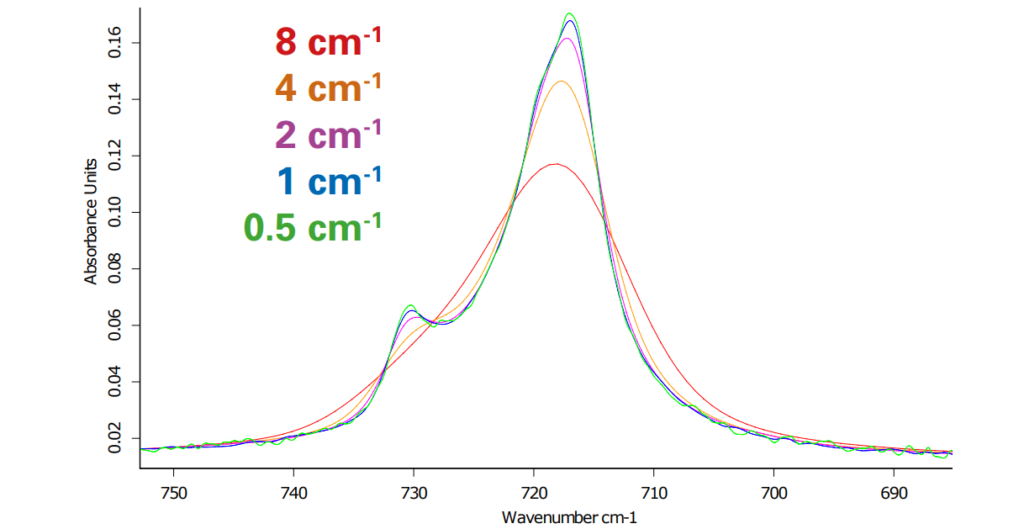
Figure 2 shows the same spectra as Figure 1 but zoomed into the area of interest around 731 cm-1. At 4 cm-1 resolution you can make out a „shoulder“ rising from the main signal @ 717 cm-1. At 2 cm-1 resolution this peak is then fully resolved. This is used to distinguish high densitiy (HDPE) from low density (LDPE) polyethylene.
A further increase in spectral resolution has no beneficial effect.
But why is that?
The natural width of spectral bands in solids and liquids are in the order of several wavenumbers.
This means that, by the law of physics, measurements at high resolutions are ineffective for solids and liquids. But be careful, this could you lead to the deceptive conclusion to simply measure all solid and liquid samples at 2 cm-1 resolution, but this will not improve your experiment.
Higher resolutions affect measurement time
The change in spectral resolution also influences other important measurement parameters. In order not to delve too deeply into the instrument technology, we will describe the reason for this in brief.
In order to achieve a higher resolution, the mirror inside the interefometer must travel a longer distance for a single scan. This means that fewer scans can be recorded in the same time. If fewer scans are recorded, the signal-to-noise ratio of the resulting spectra will significantly suffer.
Of course, you can increase the number of scans, which will unfortunately also increase measurement time. But as stated before, why should you invest this extra time without benefit?
Conclusion
Even if your spectrometer allows a resolution of < 4 cm-1, you should not apply them for the analysis of liquids and solids. Even worse, in these cases they will only increase measurement time or reduce the S/N ratio if you do not adjust the number of scans accordingly.
If you are still interested in the topic and want a more detailed explanation, download our spectral resolution application note.
You’ve got other questions? Don’t hesitate and contact us through our website or take a look at our FTIR and Raman applications on this blog!
Bruker is the innovation leader in vibrational spectroscopy and offers infrared as well as Raman (micro) spectrometers. We love talking to our customers and always try to find the best solution to the analytical task at hand.