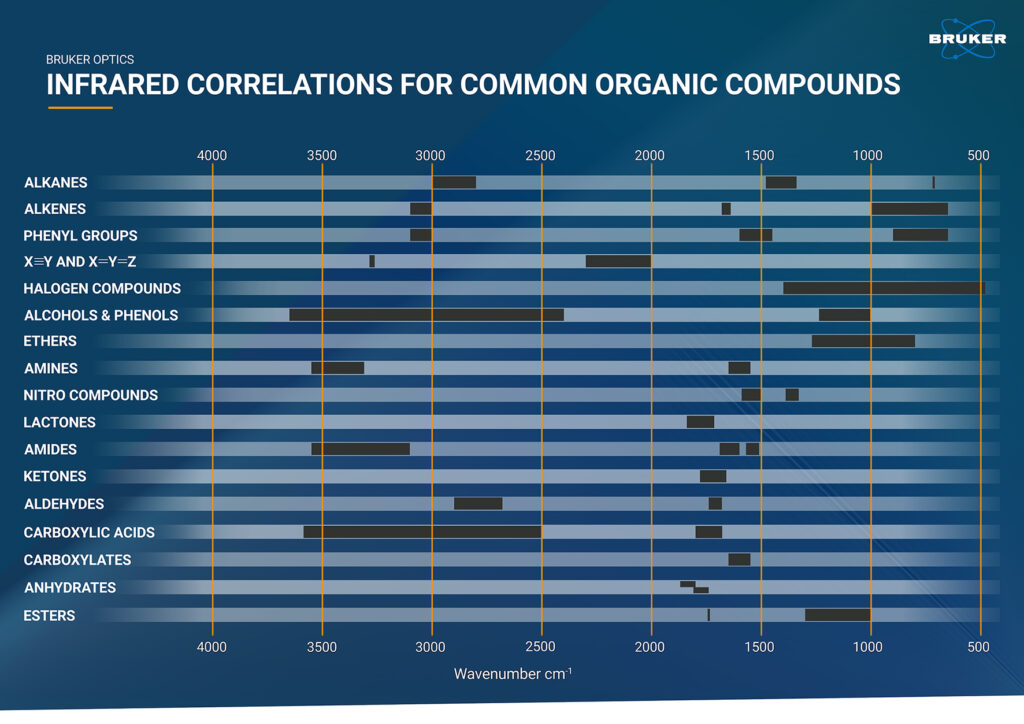
Infrared correlation charts are graphical tools used in interpreting infrared (IR) spectra of organic compounds. These plots provide reference data corresponding to the characteristic molecular vibrations of different functional groups.
In the ever-evolving world of analytical techniques, we are constantly witnessing new developments of cutting-edge technology and sophisticated instruments. The infrared (IR) correlation chart is one tool that has stood the test of time even though it seems a „bit“ dated.
Let’s explore why this „dinosaur“ of spectra interpretation persisted for so long and whether it still holds its relevance in our fast-paced world.
The timeless appeal of IR correlation charts
People using FTIR spectroscopy in the past relied on IR correlation charts to identify materials through infrared spectra. Moreover, these charts also served as trusted companions in the identification of functional groups. Beside, their high information content and condensed nature made them ideal for sharing and on-site analysis. Why? Because the search for quick answers required nothing more than a glance at the reference values.
This straightforward and visual approach especially comes in handy in a university settins. It teaches students the value of interpreting functional groups and makes complex data more accessible. Thus, they learn to recognize the characteristic peaks of different functional groups, acquiring a solid foundation in compound analysis.
This still proves useful in the laboratory as well. IR charts are still indispensable in organic chemistry, pharmaceuticals, and material science. For instance, researchers use them to swiftly identify and confirm functional groups in newly synthesized compounds. They achieve this by comparing observed peaks in the FTIR spectrum to characteristic absorption frequencies on the chart. Moreover, this verification is crucial for successful synthesis and aids in troubleshooting and optimizing the process.
Using an IR correlation chart is resource-efficient for functional group identification, particularly when access to advanced software or extensive databases is limited or unnecessary for preliminary analysis.
A niche remnant in modern chemistry
But even though IR correlation charts are still around and being used, there is no denying that they have become niche remnants in today’s FTIR landscape.
With modern FTIR devices at our disposal, it is possible to effortlessly explore vast databases with an extensive amount of compounds. This even includes rare and custom structures. The ease of automated analysis streamlines the identification process, while spectral comparisons, peak assignments, and quantitative analysis enhance our understanding of the sample.
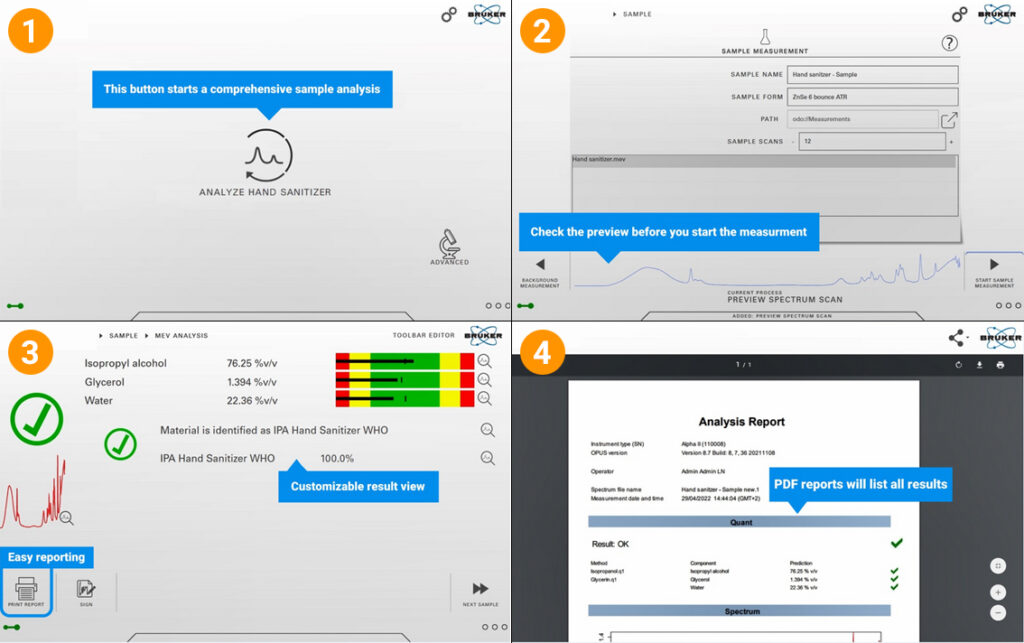
In this context a prime example is Bruker’s OPUS software which is included in all our devices. The OPUS software suite seamlessly combines a wide range of functionalities with user-friendly features and scalable performance. Additionally, with the groundbreaking OPUS TOUCH, Bruker offers the industry’s first touch-operated software for infrared spectroscopy. It provides an intuitive and accessible control over your infrared analysis like never before. For FTIR beginners, it ensures the highest accessibility, while granting experts full control over the instrument.
Conclusion
IR correlation charts offer portability, cost-effectiveness, and visual reference. Because of this, they are still of interest in some fields such as the research sector. However, in comparison, modern tools provide comprehensive databases, automated analysis, and enhanced accuracy.
What’s your choice?
In the end, this depends on specific requirements, resources, and the level of sophistication needed for compound identification.
But no matter what you choose, Bruker always offers the right solution.
In case you want to learn more about compound identification we suggest you read our blog article about spectral libraries.