
Scientists have recently found a way to visualize the sucrose distribution in barley without destroying its cells or the plant’s delicate tissue structure. It may not stand out immediately, but that’s truly something special.
Of course, it has long been possible to determine the exact sucrose contents of a plant using traditional methods. Nevertheless, the necessary extraction processes destroy the plant, making it impossible to determine how much sugar was present in which part of the plant.
Developing new methods
As non-destructive techniques, Infrared spectroscopy (IR) and FPA imaging seem to be an ideal choice to look at the sucrose distribution within the intact plant. In the present analytical case, however, some sample preparation was required.
The scientists first froze the plant and then cut it into very thin sections (<10 µm). These tissue sections were then analysed using FPA imaging, which resulted in a very complex data set of all components present.
The challenge was now to isolate exactly those signals belonging to sucrose. In the end, the team from the Leibniz Institute of Plant Genetics and Crop Plant Research (IPK) succeded.
Fascinating results by FPA imaging
Source: GIT-Laborportal, „Mehr Sehen mit Infrarot“, 18.07.2019.
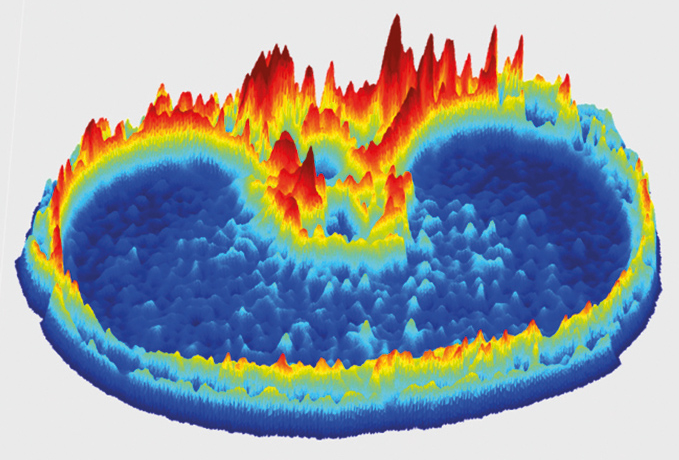
Figure 1 visualizes the sucrose distribution in a barley grain. Red areas indicate large sucrose concentrations while blue parts correspond to lower amounts. It is evident, that the sugar concentration within the grain is subject to considerable fluctuations.
It was this unexpected fluctuation that led the researchers to suspect unknown processes that influence sucrose transport. The sugar is transported out of the leaf and enters the developing grains via a central vein. After accumulation, it is transported along a concentration gradient to the starch storage tissue inside the grain.
A new tool for crop breeding
The method developed by IPK has the potential to resolve the spatial distribution of metabolites and photosynthates in crop plants. With these parameters, researchers are then able to develop and characterize higher yielding crop varieties.
The study provided even more information, but talking about everything would certainly go beyond the scope of this blog. However, you can check the details within the original publication.
You have questions about FPA imaging or FTIR microscopy? Don’t hesitate and contact us through our website or take a look at our quick guide to FTIR microscopy.