Paper is an everyday item all over the world, so it comes as no surprise that FTIR microscopy plays a role in the paper quality control. It enables the analysis of chemical composition and simplifies the quality control in paper products. In this blog article we report on the challenges of failure analysis in the paper industry and show how FTIR can assist in meeting these obstacles.
Challenges of paper failure analysis
Did you know that modern paper is made up of a complex blend of different components? From fibers to glues and impregnating agents, paper also contains fillers, which can make up to 30% of its composition. These fillers, such as calcium carbonate play a crucial role in optimizing properties like printability, glare, and opacity. However, once these components are combined, they become visually indistinguishable. Thus making it challenging to identify defects or analyze the paper’s composition.
Meeting the challenge with FTIR
Enter FTIR microscopy.
Traditional macroscopic measurement methods often fall short when dealing with the inhomogeneous composition of paper and the microscopic nature of defects. However, with the help of an FTIR microscope, we can explore the hidden world of paper composition. By measuring IR spectra with high lateral resolution, it is possible to uncover the chemical composition of defects. Additionally, we can conduct qualitative analysis of the paper’s components. By this we can provide valuable insights into their distribution within the sample area.
In the following we give two application examples of FTIR microscopy in the paper industry. For the analyses we used Bruker’s FTIR microscope LUMOS II as it quickly locates and identifies defects in paper.
Example 1: Impurities in paper
The first example shows the analysis of an impurity on the surface of a paper sample. Such contamination could for example impact the paper’s print-ability, or have regulatory implications, especially in industries such as food packaging or medical applications.
For the analysis and exact localization of the contamination, a grid measurement of 47 x 35 measurement points was performed covering an area of 2.25 x 1.75 mm. Hence, an area of 50 x 50 μm can be assigned to an individual spectrum.
The Figure below shows spectra measured on a clean and a contaminated paper area, respectively. After the analysis the contamination was identified with Bruker’s OPUS software by a search in a digital library.
A chemical image of the distribution of the contamination can be created by the integration of the band at 1100 cm-1. The resulting intensities are shown color-coded below.
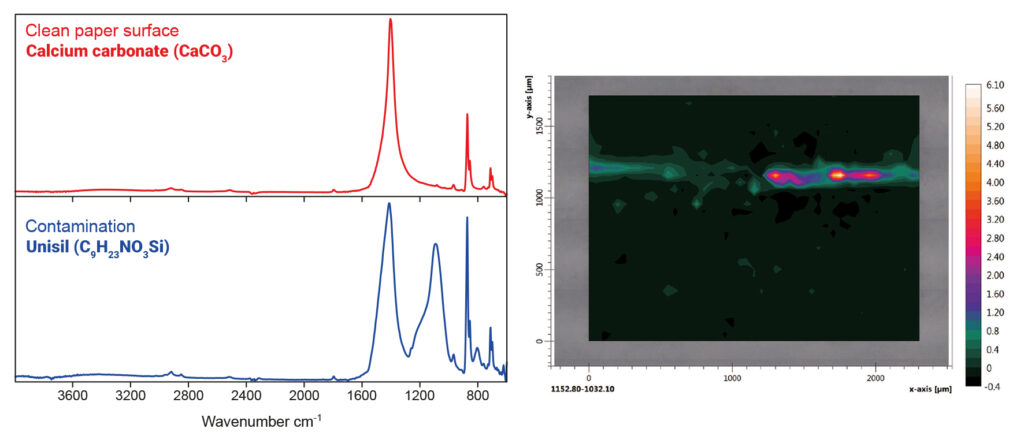
In comparison to the homogeneous white paper surface observed with an optical microscope, the IR image offers great contrast and shows exactly where which ingredients are located. This allows conclusions to be drawn about the quality of the paper.
Example 2: Analysis of a punctual defect

This example identifies a small defect (see above) and analyzes the filler distribution in a sample. The figure below shows spectra of the defect and paper at different positions. The paper spectra display typical cellulose bands and varying calcium carbonate content, also visible in the defect’s spectrum. There are additional unexplained spectral bands. The result of a mixture analysis (figure below) identified the components as paper, Struktol® and Evatane®.
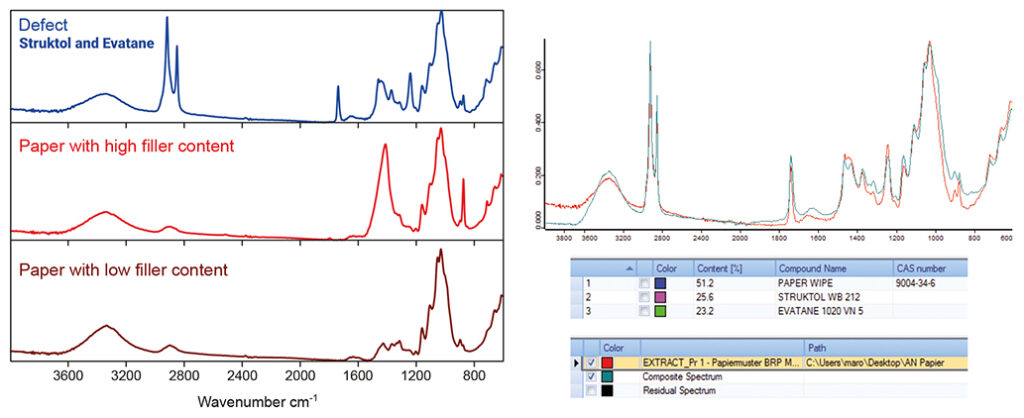
How did this happen? Evatane® is inter alia added to paper formulations to improve the bonding between fibers. Thus it is possible that this substance was not evenly distributed in the paper during production. The same applies to Struktol® as it is often used to improve the paper’s surface characteristics such as water resistance.
Summary
In summary, FTIR benefits paper industry by analyzing the chemical composition and enhancing quality control. By overcoming the challenges posed by the complex blend of components in paper and the microscopic nature of defects, FTIR microscopy provides insights into the hidden world of paper composition. It allows for the identification of defects, qualitative analysis of components, and the visualization of impurities through chemical imaging. With the ability to locate and identify defects quickly, FTIR microscopy, exemplified by Bruker’s FTIR microscope LUMOS II, offers valuable assistance in meeting the challenges of failure analysis in the paper industry.
If you want to know more about FTIR in failure analysis have a look at this article about teabag quality control: